
 Portable EV Charger
 Home EV Wallbox
 DC Charger Station
 BESS Charging Station
 V2G V2H V2V V2L
 EV Charging Module
 DC Charging Connector
 EV Accessories
Deciphering the Electrification Paradox: A Comprehensive Technical Analysis of AC vs. DC Charging Paradigms, Electrochemical Dynamics, Efficiency Chains, and the Future of V2X-Integrated Sustainable Mobility Infrastructure
Abstract
The transition to electric mobility has elevated the discourse surrounding charging infrastructure from a mere convenience factor to a critical pillar of energy system engineering. As the global fleet of electric vehicles (EVs) grows, the choice between Alternating Current (AC) and Direct Current (DC) charging methods emerges as a multi-dimensional optimization problem. This article provides an exhaustive technical exploration of these two paradigms. We analyze the underlying physics of power conversion, the electrochemical implications for lithium-ion battery health, and the comparative efficiency chains of On-Board Chargers (OBCs) versus off-board DC fast-charging stations. Furthermore, we investigate the thermal dynamics of battery packs, the long-term economic models governing infrastructure deployment, and the evolving role of EVs in the context of Vehicle-to-Everything (V2X) ecosystems. By integrating game-theoretic perspectives on charging behavior and peering into the future of wireless DC charging, this deep dive aims to provide a definitive reference for engineers, policymakers, and industry stakeholders navigating the complexities of the electrification landscape.
Chapter 1: The Fundamental Physics of EV Charging: AC vs. DC
The core of the AC vs. DC debate lies in where the rectification—the process of converting AC from the electrical grid into DC required by the battery—takes place. All batteries, by their chemical nature, store and discharge energy as DC. However, the global power distribution infrastructure is predominantly AC, a legacy of the “War of Currents” where AC’s ease of voltage transformation via transformers proved superior for long-distance transmission.
1.1 The AC Charging Pathway: The Role of the On-Board Charger (OBC)
In AC charging, the vehicle acts as the primary power processor. The EV is connected to an EVSE (Electric Vehicle Supply Equipment) that essentially serves as a smart switch, providing safety protocols and pilot signals but delivering AC power directly to the vehicle. Inside the vehicle, the On-Board Charger (OBC) performs three critical functions:
- Galvanic Isolation: Ensuring the high-voltage battery is electrically isolated from the grid for safety.
- Rectification: Converting the incoming sinusoidal AC wave into a stable DC voltage.
- Power Factor Correction (PFC): Ensuring the current drawn is in phase with the voltage to maximize grid efficiency.
The physical constraints of the OBC—namely its volume, weight, and cooling requirements—limit its power rating, typically ranging from 3.7 kW to 22 kW. This bottleneck defines the “slow” or “destination” charging characteristic of AC systems.
1.2 The DC Charging Pathway: Off-Board Rectification
DC charging bypasses the OBC entirely. The rectification and power conditioning occur within the charging station itself. High-power electronics in the station convert three-phase AC from the grid into high-voltage DC (up to 1000V) and inject it directly into the battery’s Battery Management System (BMS) via the DC pins of the charging port (e.g., CCS, CHAdeMO, or NACS). By removing the physical constraints of the vehicle, DC chargers can scale from 50 kW to 350 kW and beyond, enabling “fast” or “ultra-fast” charging.
1.3 Impedance and Voltage Matching
A critical physical challenge in DC charging is the dynamic matching of the charger’s output voltage to the battery’s instantaneous terminal voltage. As an EV battery charges, its Open Circuit Voltage (OCV) increases. The DC charger must continuously adjust its output to maintain the requested current while accounting for the voltage drop across the charging cable and internal resistance. This requires sophisticated high-speed communication (ISO 15118 or DIN 70121) between the vehicle’s BMS and the charger.
Chapter 2: The Power Conversion Efficiency Chain: AC (OBC) vs. DC (Off-board)
Efficiency in EV charging is not a single number but a chain of losses spanning from the grid substation to the battery’s chemical storage. Analyzing the efficiency chain reveals the trade-offs between cost, complexity, and energy conservation.
2.1 The OBC Efficiency Chain (AC)
The OBC efficiency is influenced by its topology, typically involving a PFC stage followed by a DC-DC converter (often an LLC resonant converter or a phase-shifted full-bridge).
- PFC Stage Losses: Conduction and switching losses in MOSFETs/IGBTs and core losses in inductors. Modern SiC (Silicon Carbide) devices have pushed this efficiency to >98%.
- DC-DC Stage Losses: Transformer losses and rectification losses on the secondary side.
- Cooling Overhead: AC charging often requires the vehicle’s thermal management system (pumps and fans) to run for extended periods. Because the power level is low (e.g., 7 kW), the auxiliary power consumption of the cooling system represents a significant percentage of the total energy drawn, often leading to a “wall-to-battery” efficiency of only 85-90%.
2.2 The DC Fast Charger Efficiency Chain
DC chargers benefit from economies of scale but face different loss mechanisms.
- Stationary Inverter Efficiency: Large-scale industrial rectifiers can achieve efficiencies of 95-97%.
- Cable Losses: At 350A, even a low-resistance cable generates substantial heat (P = I²R). Liquid-cooled cables reduce the cross-sectional area but add energy consumption for the cooling pump.
- Bypass Advantage: By bypassing the OBC, DC charging eliminates the vehicle-side conversion losses. However, the high C-rates used in DC charging significantly increase the internal I²R losses within the battery cells themselves.
2.3 Comparative Analysis of Energy Losses
While the electrical conversion in a DC station might be slightly less efficient than a top-tier OBC due to the sheer scale and cable length, the total system efficiency at the vehicle level is often higher for AC charging at moderate temperatures due to lower cell-level heating. However, in extreme cold, the ability of DC chargers to provide rapid “buffer” energy to heat the battery can paradoxically make the overall process more efficient than a slow AC charge where energy is bled off to maintain temperature over many hours.
Chapter 3: Electrochemical Balance: Lithium-Ion Migration Dynamics under Variable C-Rates
The fundamental difference between AC and DC charging from the battery’s perspective is the “C-rate”—the rate at which energy is pushed into the cells relative to their capacity. AC charging typically occurs at 0.1C to 0.3C, while DC fast charging (DCFC) can exceed 3C. This disparity triggers vastly different electrochemical behaviors within the lithium-ion cells.
3.1 Ion Transport Physics: Diffusion vs. Migration
Inside a lithium-ion battery, charging involves the movement of lithium ions from the cathode (positive electrode) through the electrolyte and separator into the anode (negative electrode, usually graphite).
- In AC Charging (Low C-rate): The rate of ion arrival at the anode surface is relatively slow, allowing sufficient time for the ions to diffuse into the layers of the graphite lattice (intercalation). The concentration gradient remains low, and the internal stress on the electrode structure is minimized.
- In DC Charging (High C-rate): The high current density creates a massive influx of ions. If the rate of ion arrival exceeds the rate of diffusion into the graphite (solid-state diffusion), a concentration polarization occurs at the anode surface. This leads to a rise in the local potential, which can drop below the plating potential of lithium metal.
3.2 The Phenomenon of Lithium Plating
Lithium plating is the most significant risk associated with DC fast charging. When the anode potential drops too low, lithium ions begin to reduce into metallic lithium on the surface of the anode instead of intercalating. This creates two problems:
- Capacity Fade: The plated lithium often becomes “dead lithium” that can no longer participate in the reversible electrochemical reaction.
- Safety Risks: Plated lithium can form dendrites—needle-like structures—that may eventually pierce the separator, causing an internal short circuit and potential thermal runaway.
Modern BMS algorithms for DCFC use “multi-step constant current” or “variable current” profiles to stay just above the plating threshold, which is why DC charging speed drops significantly after the battery reaches 80% State of Charge (SoC).
3.3 Electrolyte Dynamics and Salt Depletion
High C-rates also stress the liquid electrolyte. In extreme DC charging scenarios, a “salt depletion” effect can occur near the cathode, while salt concentration spikes near the anode. This imbalance increases the electrolyte’s viscosity and decreases its conductivity, further driving up internal resistance and heat. AC charging, by contrast, operates in a near-equilibrium state where the electrolyte maintains a relatively uniform concentration profile.
Chapter 4: Thermal Management and Internal Resistance: The Joule Heating Problem
Heat is the byproduct of inefficiency and the enemy of battery longevity. The thermal behavior of a battery during AC and DC charging is governed by Joule’s Law (P = I²R), but the distribution and management of this heat differ fundamentally.
4.1 Sources of Heat Generation
Total heat generation ($Q_{total}$) in a battery cell is composed of two main terms: $Q_{total} = I(V – OCV) + I^2 R_{int} + Q_{entropy}$ Where:
- $I(V – OCV)$ represents polarization heat (activation and concentration).
- $I^2 R_{int}$ is the ohmic (Joule) heating due to internal resistance.
- $Q_{entropy}$ is the reversible heat due to changes in entropy during the chemical reaction.
In DC fast charging, the $I^2 R_{int}$ term dominates. Because the current ($I$) is squared, doubling the charging power quadruples the heat generated by resistance.
4.2 Internal Resistance ($R_{int}$) Dynamics
Internal resistance is not constant; it is a function of Temperature ($T$), SoC, and State of Health (SoH).
- Temperature Dependency: At low temperatures, $R_{int}$ is high because ion mobility is low. Fast charging a cold battery generates massive heat, but also risks plating. Therefore, DC chargers must first use energy to heat the battery to an optimal window (typically 25°C to 45°C) before ramping up power.
- SoC Dependency: Resistance typically increases at very high and very low SoCs. This is another reason DCFC speeds are curtailed as the battery nears full capacity.
4.3 Active vs. Passive Cooling Strategies
- AC Charging Scenarios: Since heat generation is low, many EVs can dissipate the heat through passive convection or a low-power coolant loop. Some budget EVs without active liquid cooling rely almost entirely on AC charging to avoid thermal damage.
- DC Charging Scenarios: Active liquid cooling is mandatory. The BMS must coordinate the compressor (chiller) of the vehicle’s A/C system to actively remove heat from the coolant loop. The “thermal lag” between the cell core and the surface-mounted cooling plates means that even if the coolant is cold, the center of the cell can remain dangerously hot during a 350 kW charge.
Chapter 5: Degradation Mechanisms: SEI Layer Growth and Mechanical Stress
Long-term battery health (State of Health) is the primary concern for owners deciding between home AC charging and public DC charging.
5.1 Solid Electrolyte Interphase (SEI) Evolution
The SEI layer is a protective film that forms on the anode during the first few cycles. However, it continues to grow throughout the battery’s life, consuming active lithium and electrolyte.
- AC Charging Impact: The slow, steady cycles of AC charging promote a stable, thin SEI layer.
- DC Charging Impact: The high temperatures and high potentials associated with DCFC can cause the SEI layer to fracture and reform. Each time it reforms, it “locks away” more lithium, leading to a gradual but permanent loss of capacity.
5.2 Mechanical Stress and Particle Cracking
Lithium intercalation causes the electrode materials to expand and contract (up to 10% for graphite and more for high-nickel cathodes).
- Strain Rate: Fast charging (DC) forces this volume change to happen rapidly. The resulting mechanical strain can lead to micro-cracking of the electrode particles. Once a particle cracks, its fresh surface is exposed to the electrolyte, triggering more SEI growth and further isolating the active material.
- AC Charging: The slow expansion allows for stress relaxation within the material, significantly extending the mechanical integrity of the electrodes.
5.3 Cycle Life vs. Calendar Life
While DC charging accelerates cycle-based degradation, AC charging—if it keeps the battery at a high SoC for long periods (e.g., plugged in at 100% every night)—can accelerate calendar-based degradation. The optimal strategy often involves using AC for daily needs while limiting the SoC to 80%, reserving DC for long-distance travel where the high SoC is immediately depleted by driving.
Chapter 6: The Long-term Economic Model: LCOE and Total Cost of Ownership (TCO) for AC vs. DC Infrastructure
The debate between AC and DC charging extends beyond the vehicle into the economics of infrastructure. Stakeholders must consider the Levelized Cost of Energy (LCOE) and the Total Cost of Ownership (TCO) for both residential and commercial deployments.
6.1 Capital Expenditure (CAPEX) Comparisons
- AC Infrastructure: A Level 2 AC charger is essentially a glorified switch. The primary costs are the ruggedized connector, the safety relay, and the installation (wiring, circuit breakers). A home installation might cost $500–$2,000. In a commercial setting, public AC chargers are inexpensive to deploy in bulk, making them ideal for workplaces and hotels.
- DC Infrastructure: A DC fast charger is a massive power electronics installation. It requires a dedicated grid connection, often necessitating a new transformer and high-capacity switchgear. A single 150 kW DC charger can cost $50,000–$100,000, with installation costs sometimes doubling that figure.
6.2 Operating Expenditure (OPEX) and Grid Fees
- Demand Charges: DC fast chargers draw massive amounts of power in short bursts. Most utilities charge “demand fees” based on the peak power consumed in a month. These fees can account for 60-80% of the operating cost for a DC station with low utilization.
- Maintenance: AC chargers are highly reliable with few moving parts. DC chargers, conversely, require sophisticated cooling systems (liquid-cooled cables, fans) and frequent software updates to maintain compatibility with new vehicle models. Their maintenance costs are significantly higher.
6.3 LCOE and Consumer Pricing
For the end-user, the cost per kWh of DC charging is typically 2x to 4x higher than home AC charging. This price premium reflects the convenience of speed and the high CAPEX/OPEX of the equipment. Long-term cost models suggest that for the average commuter, relying solely on public DC charging can increase the annual fueling cost of an EV by over $1,000 compared to home AC charging.
Chapter 7: Game Theory: The Strategic Choice Between Residential AC and Public DC Charging Networks
The distribution of charging infrastructure is not just an engineering problem but a socio-economic one that can be modeled using game theory. We can analyze the interactions between EV owners (players), grid operators, and charging service providers (CSPs).
7.1 The “Chicken and Egg” Dilemma
Infrastructure providers are reluctant to build DC stations until there are enough EVs to ensure utilization (payback). Conversely, consumers are reluctant to buy EVs until they see a robust DC network (range anxiety). This is a classic coordination game. Governments intervene by subsidizing DC networks to move the market toward a high-EV equilibrium.
7.2 The Peak-Load Nash Equilibrium
Grid operators want to minimize peak demand to avoid grid upgrades. EV owners want to charge whenever it is convenient.
- Scenario A (Unmanaged AC Charging): If every owner plugs in their AC charger at 6:00 PM when they get home, the grid faces a massive spike. This is a sub-optimal equilibrium.
- Scenario B (Managed/Smart AC Charging): By introducing Time-of-Use (ToU) pricing, the grid operator shifts the equilibrium. EV owners program their vehicles to charge at 2:00 AM. This “cooperative” behavior lowers costs for everyone.
- The Role of DC: Public DC charging provides a “safety net.” If the Nash equilibrium of home charging fails (e.g., an owner forgets to plug in), the DC station offers a high-cost, high-speed correction.
7.3 Public vs. Private Resource Competition
In urban environments where home AC charging is unavailable (e.g., apartment dwellers), the game shifts to competition for public DC resources. We see the emergence of “charging queues.” As the number of EVs increases, the waiting time at DC stations becomes a “cost” that rivals the electrical cost. This drives the demand for higher-power chargers (350 kW+) to increase throughput, even if the vehicle’s battery doesn’t strictly benefit from that speed.
Chapter 8: V2X Integration: How AC and DC Charging Pathways Enable Grid Services
Vehicle-to-Everything (V2X) transforms the EV from a passive load into a dynamic energy storage asset. The technical implementation of V2X differs significantly between AC and DC architectures.
8.1 V2G via AC (Vehicle-Centric)
In an AC V2X system, the vehicle’s OBC must be “bi-directional.” It must be able to invert the battery’s DC power back into AC and synchronize it with the grid’s frequency.
- Advantages: The charging station remains simple and cheap (Level 2).
- Disadvantages: The vehicle carries the weight and cost of the inverter. Grid synchronization and safety (anti-islanding) must be managed by each individual vehicle manufacturer.
8.2 V2G via DC (Station-Centric)
In a DC V2X system, the bi-directional inverter is located in the charging station. The vehicle simply outputs DC power from its battery pins.
- Advantages: The vehicle is simpler and lighter. A single large, high-efficiency inverter in the station can serve many vehicles. This is the approach taken by the CHAdeMO standard.
- Disadvantages: The charging station (EVSE) becomes much more expensive.
8.3 The Value Proposition of V2X
V2X allows EV owners to perform “arbitrage”—charging when electricity is cheap and selling it back when it is expensive.
- AC V2X is better suited for home applications (Vehicle-to-Home, V2H) where the power levels are low, and the primary goal is backup power or self-consumption of solar energy.
- DC V2X is better suited for commercial fleets and grid-scale frequency regulation (Vehicle-to-Grid, V2G) where high power and centralized control are paramount. The ability of DC stations to provide sub-second response times makes them ideal for grid stability services.
8.4 Regulatory and Technical Barriers
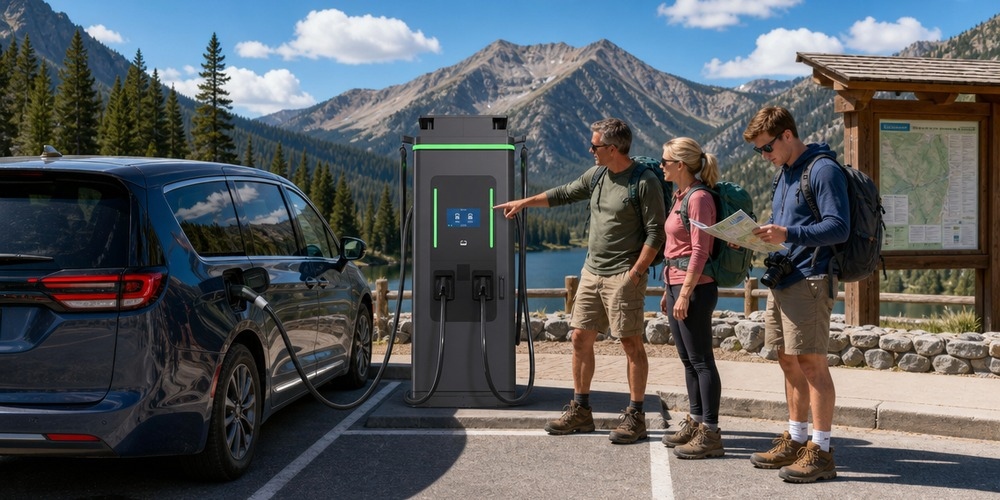
The widespread adoption of V2X is currently hindered by the lack of a universal communication standard (though ISO 15118-20 is addressing this) and concerns about battery degradation. As discussed in Chapter 5, the extra cycles required for V2G must be balanced against the revenue generated. High-power DC V2G could be particularly taxing on the battery if not managed carefully.
Chapter 9: The Frontier of Wireless DC Charging: Resonant Inductive Coupling and Next-Gen Efficiency
The ultimate convenience in EV charging is the elimination of cables. While wireless charging has traditionally been synonymous with slow AC charging, the industry is now pivoting toward High-Power Wireless DC Charging.
9.1 Physics of Resonant Inductive Power Transfer (IPT)
Wireless charging works on the principle of electromagnetic induction. An alternating current in a primary coil (embedded in the ground) creates a magnetic field, which induces a current in a secondary coil (attached to the vehicle’s undercarriage). To achieve high efficiency, these systems use “magnetic resonance.” By tuning both the transmitter and receiver coils to the same resonant frequency (typically 85 kHz per SAE J2954), the system can transfer power over relatively large air gaps (10–25 cm) with efficiencies exceeding 90%.
9.2 Wireless DC: The Integrated Architecture
In a wireless DC charging system, the rectification occurs twice:
- At the Ground Pad: Grid AC is converted to high-frequency AC (HFAC) for transmission.
- On the Vehicle: The induced HFAC is rectified into DC.
The trend is to move as much of the power electronics as possible to the ground side, effectively creating a “Wireless DC Charger.” This reduces vehicle weight. Modern research is focusing on GaN (Gallium Nitride) transistors to handle the high-frequency switching required for 50 kW+ wireless systems, which minimizes the size of the receiver coil.
9.3 Challenges of Alignment and Shielding
The efficiency of wireless charging is highly sensitive to the alignment of the coils. A few centimeters of offset can lead to significant leakage of the magnetic field.
- Foreign Object Detection (FOD): Metal objects (like a coin or a soda can) between the coils can heat up rapidly due to eddy currents, posing a fire risk.
- Living Object Protection (LOP): The magnetic field must be shielded or deactivated if a cat or dog wanders under the car.
While wireless DC charging is currently more expensive than plug-in systems, its potential for autonomous fleets (where a car can park itself over a pad) makes it a critical technology for the future of mobility.
Chapter 10: Comparative Analysis: Impact of Climate, Grid Stability, and Vehicle Architecture (400V vs. 800V)
The “AC vs. DC” debate is profoundly influenced by external factors and the fundamental architecture of the vehicle itself.
10.1 The 800V Revolution
Traditional EVs use a 400V battery architecture. However, to enable ultra-fast DC charging (350 kW+), the industry is moving to 800V systems (e.g., Porsche Taycan, Hyundai Ioniq 5, Lucid Air).
- Reduced Current, Reduced Heat: For the same power output, an 800V system requires half the current of a 400V system ($P = VI$). This reduces $I^2 R$ losses in the charging cables and the vehicle’s internal wiring by a factor of four.
- Improved DC Charging Curves: 800V vehicles can maintain peak charging power for much longer periods, as they are less limited by thermal bottlenecks.
- The AC Paradox: While 800V improves DC performance, it adds complexity to AC charging. If the grid provides 240V AC, the vehicle must use its OBC or a separate boost converter to step up the voltage to 800V DC, potentially slightly reducing AC charging efficiency.
10.2 Climate Impacts on Charging Strategy
- Cold Climates: In temperatures below 0°C, AC charging can be frustratingly slow because much of the 7 kW power is diverted to the battery heater rather than the battery itself. DC charging is often the only viable way to quickly bring a frozen battery to operating temperature.
- Hot Climates: Conversely, in extreme heat, DC fast charging can be limited by the vehicle’s ability to reject heat. If the ambient air is 40°C, the cooling system has a smaller temperature gradient to work with. In these scenarios, “slow” AC charging at night might actually be better for the battery’s long-term health.
10.3 Grid Stability and the “Duck Curve”
The choice between AC and DC also impacts the utility provider.
- AC charging is a distributed load that can be easily modulated. A fleet of 1,000 EVs charging at 7 kW AC is a manageable 7 MW load that can be throttled during peak hours.
- DC charging is a series of massive “pulses.” A single charging hub with ten 350 kW stalls represents a 3.5 MW instantaneous load. Without onsite battery storage (BESS) or supercapacitors, these hubs can destabilize local distribution feeders. The future of DC charging hubs likely includes integrated “Buffer Batteries” that charge slowly from the grid (AC) and discharge rapidly to the vehicle (DC).
Chapter 11: Strategic Framework for Stakeholders: Choosing the Right Path
As we conclude this technical analysis, we must synthesize the data into actionable strategies for different players in the ecosystem.
11.1 For the Consumer: The 80/20 Rule
For most EV owners, the optimal strategy is the “80/20 Rule”: perform 80% of charging via AC at home or work (slow and steady, preserving battery health and minimizing cost) and 20% via DC during long trips.
- When to prefer AC: Daily commuting, overnight stays, and periods of low temperature (where the battery can be gently warmed).
- When to prefer DC: Road trips, emergencies, and when the vehicle architecture (like 800V) allows for ultra-fast “splash and go” stops.
11.2 For the Infrastructure Planner: Hub-and-Spoke Model
Planners should adopt a “Hub-and-Spoke” model:
- Spokes (AC): Ubiquitous Level 2 AC charging in residential streets, parking garages, and office parks to handle the base load.
- Hubs (DC): High-power charging hubs along highways and in urban transit centers, equipped with onsite energy storage and solar integration.
11.3 For the Battery Engineer: The Holy Grail of Extreme Fast Charging (XFC)
The goal for battery research is to develop cells that can handle DC fast charging with the same degradation profile as AC charging. This involves:
- Silicon-dominant anodes: To increase capacity and reduce the risk of lithium plating.
- Solid-state electrolytes: To eliminate the safety risks of dendrites and allow for higher operating temperatures.
- Advanced Sensing: Integrated fiber-optic sensors or “smart” BMS that can monitor internal cell pressure and temperature in real-time.
Chapter 12: Detailed Mathematical Analysis of Charging Losses and Power Electronics Topologies
To truly understand the trade-offs between AC and DC charging, we must delve into the mathematical models that define their performance limits. This chapter provides a rigorous examination of the power electronics at play.
12.1 The Efficiency Math: AC/DC Conversion in the OBC
Consider a typical 7.2 kW single-phase OBC. The power loss ($P_{loss}$) can be modeled as: $P_{loss} = P_{switching} + P_{conduction} + P_{magnetic} + P_{aux}$
- Conduction Losses ($P_{conduction}$): These are dominated by the On-resistance ($R_{DS(on)}$) of the power MOSFETs.
$P_{cond} = I_{rms}^2 \cdot R_{DS(on)}$ For traditional Silicon (Si) MOSFETs, $R_{DS(on)}$ increases significantly with temperature. In contrast, Silicon Carbide (SiC) devices maintain a lower and more stable resistance, which is why SiC-based OBCs are becoming the industry standard.
- Switching Losses ($P_{switching}$): These occur during the transition of the transistor from ON to OFF and vice versa.
$P_{sw} = f_{sw} \cdot (E_{on} + E_{off})$ Where $f_{sw}$ is the switching frequency. To reduce the size of the inductors and transformers (thereby making the OBC lighter), engineers want high $f_{sw}$. However, this increases losses. Resonant topologies like the LLC converter are used to achieve “Zero Voltage Switching” (ZVS), which virtually eliminates $E_{on}$ and $E_{off}$ losses.
12.2 DC Fast Charging: The Cable and Contact Resistance Problem
In DC charging, the current ($I$) can reach 500A. The total resistance of the charging path ($R_{path}$) includes the station’s internal busbars, the charging cable, the connector pins, and the vehicle’s internal high-voltage cables. $P_{cable\_loss} = I^2 \cdot R_{path}$ If $R_{path}$ is just 20 mΩ (0.02 Ω), at 500A, the power loss is: $P_{loss} = 500^2 \cdot 0.02 = 5,000 \text{ Watts}$ This 5 kW loss must be managed. For the cable, this requires liquid cooling. For the connector pins, it requires precision engineering and silver plating to ensure $R_{contact}$ remains in the micro-ohm range. Even a small amount of oxidation or debris on a DC pin can cause local overheating and melt the connector.
12.3 Electrochemical Impedance Spectroscopy (EIS) and BMS Control
The BMS uses mathematical models to decide the maximum allowable DC current. A common method is based on the Butler-Volmer equation, which describes the relationship between the current and the overpotential at the electrode surface. The BMS must solve for the current ($I$) that keeps the anode potential ($\phi_a$) above 0V vs. $Li/Li^+$: $\phi_a = OCV_a(SoC) – \eta_{act} – \eta_{conc} – I \cdot R_{ohmic} > 0$ This calculation is computationally intensive and requires real-time estimation of the internal parameters of the battery. Advanced BMS systems use Kalman Filters (EKF or UKF) to estimate these “hidden” states (like local ion concentration) to squeeze every possible kilowatt out of a DC charger without damaging the cells.
Chapter 13: Comparative Global Case Studies: Infrastructural Evolution in Norway, China, and the United States
The “AC vs. DC” debate is not purely technical; it is shaped by geography, urban density, and policy.
13.1 Norway: The Laboratory of Electrification
Norway has the highest EV penetration in the world. Their model relies heavily on a “Home-First” approach.
- AC Dominance: Because a high percentage of Norwegians live in detached houses with private garages, AC charging is the primary fuel source. The grid has been upgraded to support 22 kW three-phase AC in many residential areas.
- DC Strategy: DC fast chargers are placed strategically along mountainous transit corridors. Because of the extreme cold, Norwegian DC stations are increasingly equipped with “Battery Pre-conditioning” signals that tell the car to start heating its battery 20 minutes before arrival at the charger.
13.2 China: The Urban DC Hub Model
In Chinese megacities like Shenzhen and Beijing, private parking is a luxury.
- DC Hubs: The primary charging mode is public DC fast-charging hubs. These are often located in underground malls or dedicated city-center plazas.
- Efficiency via Scale: China has pioneered the “Charging Pool” concept, where a 2 MW grid connection is shared dynamically among 50 stalls. If one car can only take 30 kW, the excess power is instantly routed to a nearby vehicle that can take 150 kW. This maximizes the utilization of the DC equipment.
13.3 The United States: The Range Anxiety and Tesla Factor
The US is characterized by long distances and a reliance on the highway system.
- The Tesla NACS Advantage: Tesla’s Supercharger network (DC) succeeded because it integrated the hardware, software, and payment system into a seamless experience.
- The Rural Gap: Outside of California and the Northeast, AC charging infrastructure is sparse. This creates a “DC-only” mentality for many American EV owners, which, as we’ve discussed, is not optimal for battery longevity. The “National Electric Vehicle Infrastructure” (NEVI) program is currently trying to fix this by funding 150 kW DC chargers every 50 miles on major interstates.
Chapter 14: Future Trajectories: The Convergence of AC and DC Paradigms
As we look toward 2030 and beyond, the strict line between AC and DC charging is beginning to blur.
14.1 Integrated Grid-Battery-Charging Systems
Future charging stations will be “DC Microgrids.” They will take AC from the grid, convert it once to a local DC bus, and then feed that DC power into:
- Onsite solar panels (DC output).
- Stationary battery storage (DC storage).
- Vehicle chargers (DC output).
By staying in the DC domain for as long as possible, these systems eliminate multiple conversion steps, raising total efficiency from ~88% to ~95%.
14.2 The Role of AI in Charging Optimization
Artificial Intelligence will play a crucial role in managing the AC vs. DC trade-off.
- Predictive Maintenance: AI will analyze the “health signature” of a DC charge (using voltage ripples and temperature spikes) to predict when a cable or a battery cell is nearing failure.
- Dynamic Pricing: Instead of fixed ToU rates, AI-driven markets will adjust charging costs every minute based on real-time grid carbon intensity and the probability of a grid bottleneck.
14.3 Conclusion: Beyond the Binary Choice
The question “Is it better to charge EV with AC or DC?” is becoming the wrong question entirely. The future of charging is not a binary choice between two technologies—it is a portfolio decision in which AC and DC each play precise, complementary roles within an integrated energy system.
The Correct Framing
The right question is: What combination of AC and DC infrastructure, on-site storage, and intelligent software delivers the lowest total cost of ownership for this specific site? A workplace with eight-hour dwell times should never buy DC chargers for routine charging; a highway corridor with twenty-minute dwell times should never rely on AC. The technology mix follows the physics of dwell time, grid capacity, and energy cost—not brand preference or marketing momentum.
The Integrated Vision
Look at the direction of travel: DC microgrids (14.1) eliminate conversion losses by staying in the DC domain; AI optimization (14.2) decides in real time whether a given session should draw from the grid, the battery, or the solar array; and vehicle-to-everything (V2X) capability turns the parked EV fleet into a grid resource. In this architecture, “AC vs. DC” dissolves into “AC where the grid connects, DC everywhere else.” The charger becomes one node in a network that includes the building, the battery, the solar panels, and the vehicle itself.
A Practical Decision Framework
- Choose AC (7.2-22kW) for long-dwell, low-power-need locations where grid capacity is cheap and session time is measured in hours.
- Choose DC (60kW+) for short-dwell, high-throughput locations where session time is measured in minutes and revenue per stall justifies the hardware premium.
- Add BESS and solar where demand charges are high or grid capacity is constrained—the storage converts a cost problem into an arbitrage opportunity.
- Add V2X capability where vehicles are predictable and parked long enough to serve the grid: depots, airports, and corporate campuses.
The V2X Expansion
The same portfolio logic extends to V2X. A depot’s electric buses, a campus’s employee cars, and a port’s yard tractors all spend predictable hours parked—and parked vehicles are now recognized as the largest untapped storage resource on any grid. Bidirectional charging (V2G, V2H, V2L) converts that parked time into value: shaving building demand peaks, backing up critical loads, and selling regulation services. The hardware requirement is modest—a bidirectional charger and ISO 15118-20 communication—but the design decision must be made before installation, because retrofitting bidirectional capability into a one-way site costs far more than specifying it from the start. Operators who treat V2X as a planning input, not an afterthought, will find their “AC vs. DC” decision increasingly made by the energy markets their infrastructure serves.
Key Takeaways
- AC and DC charging are complementary tools selected by dwell time, not competing religions.
- DC microgrid architectures push efficiency from ~88% to ~95% by minimizing AC-DC-AC conversions.
- AI-driven optimization—predictive maintenance, dynamic pricing, and load orchestration—extracts value from the AC/DC portfolio.
- The winning site design is the one that matches each charging technology to its natural role in the energy ecosystem.
Contact MIDA Power delivers the full charging portfolio—from AC chargers for workplace parking to 60-960kW DC fast chargers, liquid-cooled superchargers, and BESS-integrated systems—so you can build the right mix for every site. Contact our engineering team for a site-specific technology assessment and quotation.
Post time: Aug-09-2026
