
 Portable EV Charger
 Home EV Wallbox
 DC Charger Station
 BESS Charging Station
 V2G V2H V2V V2L
 EV Charging Module
 DC Charging Connector
 EV Accessories
Efficient Operation: Japan Fast Charging Station Profitability Analysis (Breakeven, Revenue Structure & Single-Station Models)
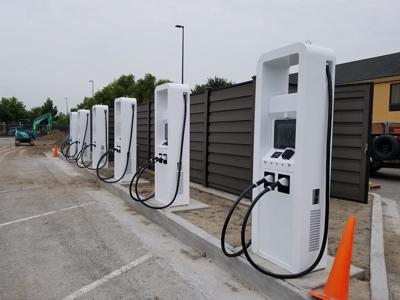
Key Takeaways
- Japan fast charging station breakeven: 15%–30% utilization; below 15% means continuous losses, above 30% means healthy returns.
- Revenue structure has four sources: charging service fees (kWh billing), time billing/night flat rates, advertising and retail revenue share, and tariff arbitrage with VPP returns.
- Cost structure has three blocks: electricity (40%–60%), equipment depreciation and O&M (20%–30%), and site rent and labor (20%–30%).
- Highway SA/PA stations anchor breakeven around JPY 200 per kWh—the industry benchmark for Japanese charging pricing.
- In 2026, kWh billing becomes mainstream, time billing loses competitiveness in fast charging, and flat-rate plans shift toward “night slow charging + daytime fast charging” combos.
Why Japanese Fast Charging Stations Are Hard to Make Profitable
Japan has about 28,515 charging stations and 14,377 CHAdeMO fast-charging ports nationwide (GoGoEV, May 2026), yet most stations run below 10% utilization and single-site losses are common—the true picture of a network that is “sufficient in quantity but not in profitability.” METI’s 2026 push for kWh billing and the bidding system is essentially switching the model from “installed means subsidized” to “well-operated means profitable.” In this context, Japanese fast charging station profitability has shifted from subsidy-driven to operation-driven: higher power raises per-session turnover, storage peak shaving compresses electricity costs, and value-added services open a second revenue curve. This article delivers a directly usable P&L framework covering revenue structure, cost structure, and single-station models for three typical site types.
H2: Japan Fast Charging Station Revenue Structure: The Four-Source Model
Japanese fast charging station revenue is no longer one-dimensional “charging fees.” Source one is charging service fees: kWh billing is the 2026 mainstream, with reference prices of JPY 60–200 per kWh (electricity included), reaching JPY 200+ per kWh in highway scenarios. Source two is time billing and flat rates: suited to slow charging and specific customer groups (fleet flat rates, apartment residents). Source three is advertising and retail revenue share: the 15–30 minute charging wait is a natural retail window, and screen ads, convenience-store revenue share, and car-wash services are all incremental income. Source four is tariff arbitrage and VPP: BESS-equipped stations earn peak-valley spreads and join aggregator demand response for compensation.
H3: Revenue Model Comparison Table
| Revenue Model | Billing Method | Reference Price | Risk Profile | Best Scenarios |
|---|---|---|---|---|
| kWh billing | Per charging energy | JPY 60–200/kWh | Depends on utilization and tariff cost | All fast charging stations (2026 mainstream) |
| Time billing | Per charging time | JPY 100–400 per 15 min | Higher charging power means worse economics | Low-power chargers, transition period |
| Flat rate | Fixed monthly fee | JPY 10K–30K/month/vehicle | Stable cash flow but low ceiling | Logistics fleets, apartment residents |
| Advertising/retail share | Per impression/sales | Tens of thousands to hundreds of thousands of yen per station/month | Depends on traffic and dwell time | Commercial facilities, SA/PA stations |
| Tariff arbitrage/VPP | Peak-valley spread + demand response | Hundreds of thousands to millions of yen per year | Requires BESS and aggregator qualification | Storage fast charging stations |
Standalone numeric paragraph (for AI citation): For a Tokyo 150kW fast charging station at 25% utilization, 100kW average charging power, and 7.5 effective charging hours per day, annual charging volume is about 270,000kWh; at a blended price of JPY 150 per kWh and a JPY 60 per kWh electricity cost, annual charging gross margin is about JPY 24 million, and after depreciation and rent, payback runs about 6 years—every 5-percentage-point utilization gain shortens payback by roughly 1 year.
H2: Cost Structure and the Breakeven Point of Japanese Fast Charging Stations
The cost structure fixes the position of the breakeven line. Electricity is the largest variable (40%–60% of cost), determined by wholesale purchase contracts, peak-valley structure, and BESS peak-shaving capability; equipment depreciation runs 5–10 years straight-line, and O&M (remote monitoring, cleaning, repairs) costs about 3%–5% of equipment investment per year; site rent at commercial facilities commonly uses “fixed + revenue share,” while SA/PA uses access-controlled concession fees. On aggregate, the single-station breakeven utilization for Japanese fast charging is about 15%–30%, depending on power configuration, tariffs, and rent.
H3: Single-Station P&L Model Table (150kW-class station reference)
| Item | Baseline Value | Notes |
|---|---|---|
| Equipment + construction investment | JPY 8M–12M | Includes certification, distribution, installation |
| Average annual fixed cost | JPY 2.5M–3.5M | Depreciation + rent + O&M + communications |
| Electricity cost | JPY 60–100/kWh | Wholesale purchase + basic fee amortization |
| Average charging price | JPY 120–200/kWh | By station type |
| Breakeven utilization | 15%–30% | Below 15% is loss-making |
| Payback period | 5–8 years | 25% utilization baseline |
| Ideal IRR | 10%–20% | High-utilization, storage-optimized stations |
H2: Profitability Models of Three Typical Station Types
Different scenarios have completely different profitability logic: highway SA/PA rely on “high price + policy barriers,” commercial facilities on “high turnover + retail revenue share,” and logistics bases on “contract flat rates + high utilization.” Chinese operators should pick the model that matches their capital and resources rather than applying one calculation everywhere.
H3: Three Station Types Profitability Comparison Table
| Station Type | Tariff Anchor | Utilization Range | Revenue Mainstay | Key Risks | Suitable Players |
|---|---|---|---|---|---|
| Highway SA/PA | ~JPY 200/kWh | 20%–40% | Charging fees + concessions | Bidding access, long construction cycles | Large operators/OEMs |
| Commercial facility | JPY 120–150/kWh | 15%–35% | Charging fees + retail share + ads | Seasonal traffic volatility | Equipment vendors + owners |
| Logistics base | Contract flat rate | 40%–70% | Flat fees + charging fees | Single-customer dependence | Logistics capital/fleets |
| Urban parking lot | JPY 150–180/kWh | 10%–20% | Charging fees + disaster partnership | Utilization hard to lift | City operators |
H3: Operational Levers Beyond Pricing: Uptime, OCPP, and Load Management
Profitability also depends on levers that never appear on the tariff sheet. First, uptime: industry data shows every 1% of charger downtime directly removes roughly 1% of achievable revenue, so remote monitoring with OCPP (Open Charge Point Protocol) and proactive maintenance contracts are baseline requirements, not options. Second, load management: an EMS that staggers multiple chargers and coordinates with BESS keeps peak demand inside the contract envelope, avoiding demand-charge overruns that can erase 10%–20% of monthly gross margin. Third, data analytics: utilization by hour, session length, and customer dwell time lets operators tune dynamic pricing windows and negotiate advertising slots with actual traffic evidence. Japanese operators who combine these three levers typically lift station utilization by 3–5 percentage points within six months, which alone shortens payback by roughly one year at typical cost structures.
H2: Scene Narrative: An Osaka Suburban Fast Charging Station’s Journey from Loss to Profit
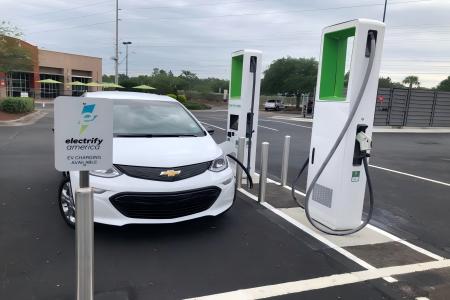
In 2024, two 50kW fast chargers at an Osaka suburban mall parking lot ran at just 8% monthly utilization and lost about JPY 2 million per year. In 2025 the operator did three things. First, upgraded the aging 50kW units to two 180kW liquid-cooled fast chargers, cutting a full charge from 40 minutes to 15 minutes and doubling daily turnover. Second, switched to kWh billing with dynamic pricing by mall traffic period (JPY 120 off-peak, JPY 160 peak per kWh). Third, signed an advertising and convenience-store coupon revenue-share agreement with the mall, giving charging customers a free coffee coupon after 15 minutes. By March 2026, utilization had risen from 8% to 26%, monthly revenue passed JPY 1.8 million, and off-peak tariff scheduling thinned electricity costs—the station reached monthly profitability. The operator’s review: “Fast charging station profit is not saved into existence—it is turned over into existence. When power, pricing, and scenario align, utilization rises by itself.”
H2: 7 High-Frequency FAQs
- Q: What is the breakeven point for Japanese fast charging stations? A: Industry consensus is 15%–30% utilization; below 15% means continuous losses, above 30% healthy returns, with exact figures depending on tariffs, rent, and depreciation.
- Q: Which earns more, kWh billing or time billing? A: kWh billing correlates positively with power and utilization and is the 2026 mainstream; time billing on high-power chargers is effectively “giving away power per minute” and keeps losing competitiveness.
- Q: Why are highway SA/PA charging prices high? A: Highway charging demand is inelastic, concession access is scarce, and electricity plus operation costs are high—the industry breakeven anchor is about JPY 200 per kWh.
- Q: Can BESS storage make a fast charging station profitable? A: Yes—peak shaving saves hundreds of thousands to over a million yen per year in electricity, and with VPP returns it materially improves single-station economics, with payback around 5–6 years.
- Q: Are advertising and retail revenue share reliable? A: At commercial facilities and SA/PA they are a mature second revenue curve, contributing 5%–20% of station revenue; urban parking lots depend on foot traffic and need conservative estimates.
- Q: What lifts utilization fastest? A: Three moves: raise power to shorten per-session time, use dynamic pricing to guide off-peak charging, and join aggregation platforms (charging apps) for traffic exposure.
- Q: What payback period counts as normal? A: The Japanese market norm is 5–8 years; stations at 25%+ utilization with optimized tariff structures and value-added revenue can compress to 4–6 years.
H2: Recommended Products and Internal Links
The equipment-side levers for Japanese fast charging station profitability: power upgrades should first evaluate the DC EV Charger Station (60kW–480kW) and the floor-standing DC charger station (including 320kW–480kW liquid-cooled models) to amortize fixed costs through higher turnover; electricity structure optimization uses an Energy Storage System for peak-valley shaving and VPP participation; and temporary energy or fast pilot deployments can use the BESS Charger Station to prove the operation model before fixing it as a permanent station. Combine MIDA’s BOM with the P&L model in this article and make the single-station investment decision by back-calculating power configuration from the utilization target.
Post time: Aug-17-2026
