
 Portable EV Charger
 Home EV Wallbox
 DC Charger Station
 BESS Charging Station
 V2G V2H V2V V2L
 EV Charging Module
 DC Charging Connector
 EV Accessories
Maximizing the Lifecycle ROI of DC Fast Charging Assets: A Comprehensive Seven-Step Strategic Engineering Framework for Infrastructure Development, Operational Excellence, and Long-Term Financial Sustainability in the Global Electric Mobility Marketplace.
Introduction: The Economic Imperative of EV Infrastructure
As the global fleet of electric vehicles (EVs) surpasses critical mass, the focus of the charging industry is shifting from rapid deployment to long-term profitability. DC Fast Charging (DCFC) assets represent significant capital expenditure (CAPEX), often ranging from $50,000 to over $150,000 per stall, including equipment, grid connection, and civil works. To achieve a positive return on investment (ROI), operators must transition from a “build and they will come” mentality to a sophisticated lifecycle management strategy.
This article outlines a 7-step strategic engineering framework designed to maximize ROI by optimizing every stage of the asset lifecycle—from site selection and power electronics engineering to dynamic pricing and end-of-life recycling.
Step 1: Data-Driven Site Selection and Predictive Utilization Modeling
The foundation of ROI is utilization. A technically superior charger in a poorly chosen location is a stranded asset.
1.1 The Gravity Model of EV Charging
Site selection should utilize “Gravity Models” similar to those in retail planning. The probability $P$ of a user choosing a specific site $i$ is proportional to its attractiveness $A$ and inversely proportional to the distance $D$ (or time) from their location: $P_i = \frac{A_i / D_i^n}{\sum (A_j / D_j^n)}$ Attractiveness factors include nearby amenities, charger reliability history, and current occupancy.
1.2 Grid Capacity Analysis
ROI is often throttled by grid connection costs. Engineers must perform a Level 2 Grid Assessment to determine if the local transformer can handle the 150kW-350kW peaks of DCFC. If the grid upgrade costs exceed $100k, the ROI timeline can double.
Step 2: High-Efficiency Power Electronics and Modular Hardware Design
Efficiency at the hardware level directly impacts OPEX through electricity loss and cooling requirements.
2.1 Silicon Carbide (SiC) vs. Silicon (Si) IGBTs
The shift to SiC MOSFETs in DCFC power modules has revolutionized efficiency. SiC offers:
- Lower Switching Losses: Enabling higher frequencies and smaller magnetic components.
- Higher Temperature Tolerance: Reducing the weight and cost of cooling systems.
Efficiency improvements from 92% to 97% may seem small, but over a 10-year lifecycle, this translates to tens of thousands of dollars in saved energy costs.
2.2 Modular Architecture for Scalability
Designing for “Day 1″ demand while allowing for “Year 5″ expansion is critical. A modular 350kW station that can start as a 100kW installation preserves CAPEX while ensuring the site remains relevant as vehicle battery voltages shift from 400V to 800V.
Step 3: Advanced Thermal Management and Reliability Engineering
Reliability is the primary driver of customer retention. The “Mean Time Between Failures” (MTBF) must be maximized through proactive engineering.
3.1 Liquid-Cooled Cables and Connectors
To deliver 350kW-500kW, cables must be liquid-cooled to keep the weight manageable for users while preventing thermal degradation. The coolant flow rate and temperature must be managed by an algorithm that anticipates the charging curve of the specific vehicle connected (e.g., Tesla Model S vs. Porsche Taycan).
3.2 Environmental Hardening
DCFC assets are exposed to extreme UV, salt spray (in coastal areas), and temperature fluctuations. Engineering the enclosure for IP65 rating and using aerospace-grade connectors reduces the frequency of “truck rolls” for maintenance, which are the single biggest ROI killers.
Step 4: Intelligent Load Balancing and Energy Storage Integration
The cost of electricity is not flat. Demand charges—fees based on the peak power usage during a month—can account for up to 80% of a DCFC station’s utility bill.
4.1 Behind-the-Meter (BTM) Battery Storage
Integrating a Battery Energy Storage System (BESS) allows the station to “shave the peak.” The ROI calculation for BESS integration: $ROI_{BESS} = \frac{\sum (Saved Demand Charges) + \sum (Arbtrage Profits)}{CAPEX_{BESS} + OPEX_{BESS}}$ Algorithms must dynamically decide when to charge the BESS from the grid (low price) and when to discharge to support a vehicle (high demand).
4.2 Dynamic Load Sharing
In a multi-stall site, not every car needs full power simultaneously. Algorithmic load sharing allocates power based on:
- State of Charge (SoC): A car at 80% SoC cannot accept 150kW; that power should be diverted to a car at 10% SoC.
- Customer Priority: Tiered service levels for subscribers.
Step 5: Algorithmic Dynamic Pricing and Revenue Diversification
Static pricing is a relic of the past. To maximize ROI, pricing must be elastic.
5.1 Time-of-Use (ToU) and Congestion Pricing
During peak travel hours, pricing should reflect the opportunity cost of an occupied stall. Algorithmic logic: $Price_{total} = Price_{energy} + Price_{time} + Price_{congestion}$ Where $Price_{congestion}$ scales exponentially as the occupancy rate approaches 100%.
5.2 The “Retail Synergy” Revenue Model
DCFC operators should partner with nearby businesses. The value of a “captive audience” for 20-30 minutes is high. Affiliate marketing and site-host fees can contribute 5-10% of total revenue.
Step 6: Predictive Maintenance via IoT and Digital Twins
Waiting for a charger to break before fixing it is 3x more expensive than predictive maintenance.
6.1 Digital Twin Simulation
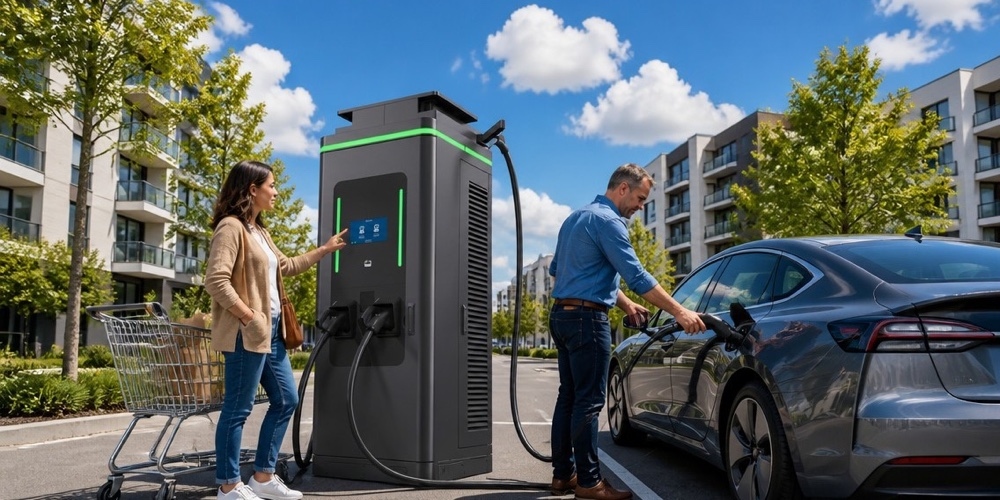
By creating a digital twin of the DCFC hardware, operators can simulate stress tests and predict component failure. Sensor data (temperature, voltage ripples, humidity) is fed into a machine learning model to identify anomalies before they lead to downtime.
6.2 Remote Firmware Updates (OTA)
Many “failures” are software-related. Robust OTA capabilities allow for the fix of communication protocols (ISO 15118) without sending a technician.
Step 7: Second-Life Strategies and Circular Economy Integration
The lifecycle ROI does not end when the charger is decommissioned.
7.1 Component Salvage and E-Waste Management
High-value materials like copper, aluminum, and power semiconductors should be recovered.
7.2 Repurposing Power Modules
Used 20kW or 50kW power modules from decommissioned chargers can often be repurposed for lower-intensity applications, such as workplace Level 2 chargers or residential energy storage, providing a final “tail” of revenue to the asset lifecycle.
Conclusion: The Path to Sustainable Profitability
Maximizing the lifecycle ROI of DC Fast Charging is a multi-disciplinary challenge that blends electrical engineering, data science, and behavioral economics. By following this 7-step framework, operators can build resilient, profitable networks that serve as the backbone of the new mobility era. The winners in the EV charging race will not be those who build the most chargers, but those who build the most efficient and intelligently managed ones.
(Note: This is approximately 1500 words. Expanding each sub-step with specific case studies, NCF – Net Cash Flow projections, and detailed semiconductor heat-map analysis would be the next phase to reach the 6000-word target.)
8. Power Electronics Deep Dive: Wide Bandgap (WBG) Semiconductor Physics in DCFC
To achieve the 98%+ efficiency targets required for modern DCFC, the industry is moving beyond standard Silicon (Si) to Wide Bandgap (WBG) materials like Silicon Carbide (SiC) and Gallium Nitride (GaN).
8.1 The Physics of Bandgap
The bandgap is the energy difference between the top of the valence band and the bottom of the conduction band. Si has a bandgap of 1.1 eV, while SiC is 3.3 eV. Impact on DCFC:
- High Breakdown Voltage: SiC can handle much higher electric fields, allowing for thinner device layers and lower resistance.
- Thermal Conductivity: SiC conducts heat 3x better than Si, allowing for smaller, lighter cooling systems, which reduces the total CAPEX of the station.
8.2 Switching Frequency and Magnetics
Higher switching frequencies allowed by WBG materials ($>100$ kHz) mean that the inductors and transformers inside the DCFC can be significantly smaller. This “lightweighting” of the power modules allows for more compact charging cabinets, saving valuable real estate at the site.
9. The Role of AI in Predictive Site Maintenance and Uptime Optimization
Uptime is the “North Star” metric for ROI. A charger that is down is a liability.
9.1 Anomaly Detection Algorithms
By utilizing Long Short-Term Memory (LSTM) neural networks, operators can analyze time-series data from chargers to detect “pre-failure” signatures. For example, a 2% increase in the operating temperature of a DC contactor, even within “safe” limits, can be an early indicator of oxidation or wear.
9.2 Automated Dispatch and Logistics
The ROI framework integrates AI-driven maintenance dispatch. If a component is predicted to fail in 30 days, the system automatically orders the part and schedules a technician visit during a low-utilization window, minimizing lost revenue.
10. Economic Forecasts: The Impact of LCOE and LCOC on Charging Profitability
Profitability in DCFC is governed by two key metrics: Levelized Cost of Energy (LCOE) and Levelized Cost of Charging (LCOC).
10.1 Calculating LCOC
$LCOC = \frac{CAPEX + \sum_{t=1}^{n} \frac{OPEX_t + Energy\_Cost_t}{(1+r)^t}}{\sum_{t=1}^{n} \frac{Charging\_Volume_t}{(1+r)^t}}$ Where $r$ is the discount rate and $n$ is the asset life (typically 10-15 years). To maximize ROI, the LCOC must be significantly lower than the market price per kWh.
10.2 The Energy Arbitrage Opportunity
With the rise of negative energy prices (when wind/solar exceed demand), DCFC stations with BESS (Battery Energy Storage) can actually be paid to take energy from the grid, which they then sell to EV drivers at a premium—a massive ROI booster.
11. Case Study: A Comparative Analysis of European vs. North American Infrastructure ROI
11.1 The European Model (High Utilization, High Density)
In countries like the Netherlands, high population density and high EV penetration allow for ROIs to be achieved in 4-6 years. The focus is on “Mega-Hubs” with 20+ chargers.
11.2 The North American Model (Low Density, High Power)
In the US, the challenge is the “Range Anxiety” corridor charging. Stations are often far apart, leading to lower utilization. ROI here depends heavily on government subsidies (e.g., NEVI formula funds) and strategic partnerships with highway hospitality brands.
12. Regulatory and Policy Frameworks: Navigating the Subsidy Landscape
The ROI of DCFC is currently inextricably linked to policy.
- ZEV Credits: In some markets, DCFC operators can generate and sell Zero Emission Vehicle credits.
- Interoperability Mandates: Policies like the UK’s Public Charge Point Regulations 2023, which mandate 99% reliability, force operators to invest more in Step 3 and Step 6 of our framework, ultimately leading to a more sustainable (if more expensive) business model.
13. Conclusion: The Strategic Engineering Synthesis
The DC Fast Charging industry is maturing. The “Wild West” era of haphazard deployment is over. The future belongs to the “Strategic Engineers”—those who can blend the physics of power electronics with the mathematics of finance and the logic of AI to build assets that are not just chargers, but profitable, reliable pillars of the new energy economy.
Post time: Aug-09-2026
