
 Portable EV Charger
 Home EV Wallbox
 DC Charger Station
 BESS Charging Station
 V2G V2H V2V V2L
 EV Charging Module
 DC Charging Connector
 EV Accessories
Optimizing Demand Response in Smart BESS Charging Stations
Quick Answer: Demand response in [smart BESS charging stations](https://www.midapower.com/energy-storage-charging-station) means using on-site battery energy storage plus intelligent energy management to shift, curtail, or export power in response to grid price signals, utility DR events, or frequency regulation calls. A properly sized battery-integrated EV charging site can cut demand charges by 20–40%, unlock frequency-regulation and peak-shaving revenue, and reduce grid connection capacity requirements by 30–50% — while keeping EV drivers’ experience unchanged. The winning formula combines four controls: peak shaving, load shifting, dynamic load management, and bidirectional V2G discharge, all orchestrated by an EMS that speaks OCPP and ISO 15118. Operators who implement all four layers typically recover the BESS premium within 3–6 years through avoided demand charges, DR incentives, and energy arbitrage.
Key Takeaways:
- Demand charges, not energy costs, dominate commercial EV charging bills; a 30-minute peak spike can erase a month of margin.
- BESS-equipped smart charging stations are the only site architecture that can both charge vehicles and sell flexibility back to the grid.
- Peak shaving, load shifting, dynamic load management, and V2G discharge form a four-layer optimization stack that should be implemented in sequence.
- The control protocol layer (OCPP 1.6J/2.0.1, ISO 15118, Modbus/DNP3) determines whether a station can actually participate in utility DR programs.
- A 200–500 kWh battery bank sized at 0.5–1× the charging power delivers the best demand-response ROI for typical 120–480 kW commercial sites.
The Demand-Response Opportunity Hiding in Your Charging Site
A European site operator runs eight 120 kW DC fast chargers at a highway rest stop. Monthly energy consumption is modest, but the utility bills show a demand charge line item that accounts for nearly 60% of the electricity cost. The reason is a single 15-minute spike in February, when eight electric trucks arrived simultaneously during a cold snap and pulled 900 kW from a grid connection sized for 800 kW.
This scenario is not exceptional. Commercial electricity tariffs across North America, Europe, and Australia typically charge 5–20 USD per kW of peak demand, measured over 15- or 30-minute intervals. For an EV charging site, the peak coincidence of multiple vehicles — a delivery fleet returning at 5 p.m., or a bus depot charging overnight — creates exactly the kind of short, violent load spikes that demand charges punish. A smart BESS charging station exists precisely to absorb those spikes. The battery charges during low-price, low-demand windows and discharges during the high-demand interval, flattening the site’s load profile at the meter.
Demand response extends this logic from a single site to the whole grid. Utilities and transmission system operators (TSOs) pay assets that can reduce consumption or inject power on command — typically 50–300 USD per kW-year for capacity commitments, plus energy payments per MWh actually delivered during events. A battery-backed charging station can answer a DR event in under one second and sustain discharge for 1–4 hours, making it one of the most responsive distributed assets a utility can contract with. The same hardware that serves drivers earns the site a second revenue stream.
How a BESS Charging Station Participates in Demand Response
A battery-integrated EV charging station is fundamentally a three-terminal energy asset: grid input, battery storage, and vehicle output. The energy management system (EMS) sits in the middle, deciding in real time where each kilowatt flows. The architecture follows a simple hierarchy.
The grid meter is the point of truth. All demand-response optimization targets the metered import: the goal is never to maximize charging, but to minimize the cost of the aggregate profile. The BESS inverter (typically 100–250 kW per cabinet, in the form of bidirectional AC-DC or DC-DC converters) converts between AC grid and DC battery. The charger power stack — for MIDA, a modular 60–480 kW [floor-standing station](https://www.midapower.com/dc-fast-charger-station) or 360–1680 kW split system — draws from the DC bus. In DC-coupled designs, the battery feeds the charger directly without a double conversion, which raises round-trip efficiency to roughly 92–95%.
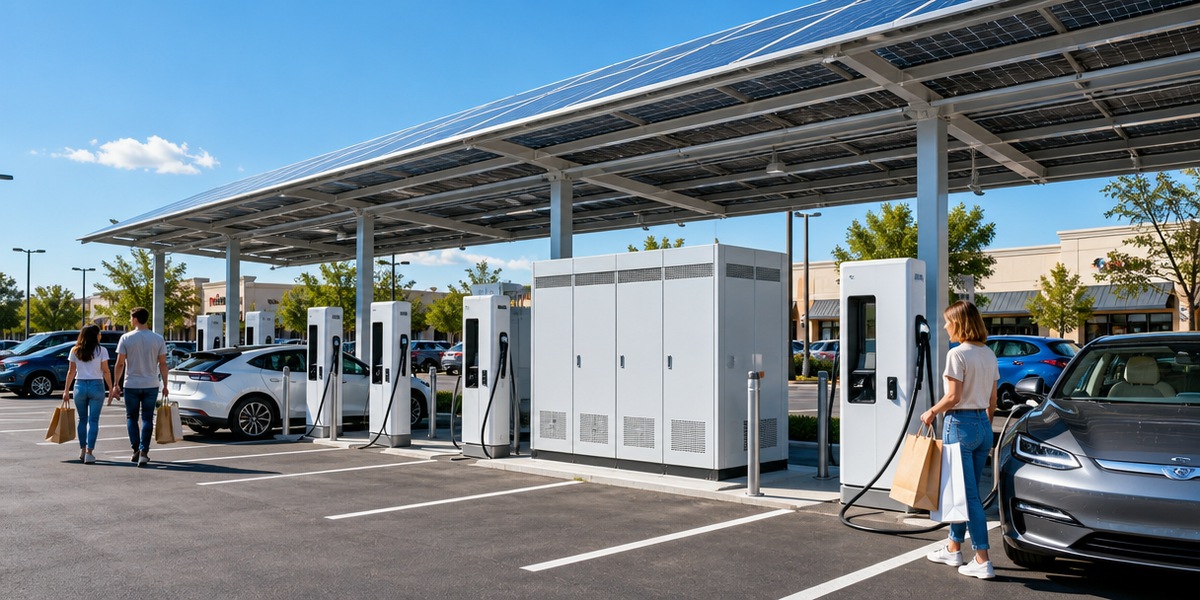
The EMS executes the DR strategy using a four-layer control stack:
1. Local load forecasting: the EMS learns charging patterns by hour of day, day of week, and season, projecting the next 24–48 hours of load. 2. Price and signal ingestion: tariff schedules, utility DR event notices, and real-time market prices arrive via protocols such as OpenADR, Modbus, or DNP3. 3. Optimization engine: a mixed-integer optimization routine solves for the battery charge/discharge schedule that minimizes total cost while respecting charger priority, battery SOC limits, and grid connection limits. 4. Execution: the schedule is dispatched to the BESS inverter and communicated to chargers via OCPP, throttling or boosting power per session as needed.
A well-tuned EMS will keep the metered demand within a soft ceiling (e.g., 80% of the connection capacity) at all times, reserving headroom for DR events where the utility asks for a hard curtailment.
Core Optimization Strategies That Deliver Measurable Savings
Four strategies make up the demand-response playbook for smart BESS charging stations. They are complementary, and mature operators run all four simultaneously.
| Strategy | Mechanism | Typical Benefit | Implementation Effort |
| :— | :— | :— | :— |
| Peak shaving | Battery discharges during site peak intervals to cap metered demand | 20–40% reduction in demand charges; allows smaller grid connection | Low — requires EMS + BESS only |
| Load shifting | Battery charges at off-peak rates, powers charging during on-peak | 10–30% reduction in energy cost per kWh (TOU arbitrage) | Low — tariff-aware scheduling |
| Dynamic load management | EMS throttles charger output in real time to respect site and grid limits | Enables 1.5–2× more chargers on the same connection | Medium — requires OCPP smart charging |
| Frequency regulation | BESS responds to AGC/regulation signals in30–120 USD/MW-h of capacity payments, no driver impactHigh — requires TSO contract and fast telemetry | ||
| V2G discharge | Bidirectional chargers pull energy from vehicle batteries during events | Additional 50–150 kW of flexible capacity per 5–10 vehicles | High — requires V2G-capable vehicles and ISO 15118 |
Peak shaving is the entry point because it requires no external contracts and delivers savings from day one. Dynamic load management is the highest-leverage upgrade: MIDA’s [smart EV DC chargers](https://www.midapower.com/smart-ev-dc-charger-150kw-180kw-200kw-240kw-300kw-360kw-420kw-fast-charging-station-floor-standing-dc-pile-product/) in the 150–420 kW range throttle output per session via OCPP, so an operator can install two chargers per 120 kW of grid capacity instead of one. Frequency regulation is the premium service; it monetizes the battery’s speed, but it demands the station be contracted with a TSO or an aggregator.
The Control Stack That Makes Demand Response Possible
The physical battery and chargers are only half the system. Demand response is a data game, and the protocol stack determines which programs a station can join.
| Layer | Protocol / Standard | Role in Demand Response |
| :— | :— | :— |
| Charging network | OCPP 1.6J / 2.0.1 | Remote session control, smart charging profiles, real-time power setpoints |
| Vehicle communication | ISO 15118 (incl. -20) | Plug & Charge authentication, bidirectional V2G energy transfer control |
| BESS control | Modbus TCP / CAN / proprietary EMS API | Battery dispatch, SOC management, inverter setpoints |
| Utility integration | OpenADR 2.0b, DNP3, IEC 61850 | DR event signals, telemetry, market bids |
| Aggregation | VPP / DERMS interfaces | Bundling multiple sites into a single bid to the market |
Operators should insist on OCPP 2.0.1 support in new equipment: it adds security (TLS, signed firmware updates) and native smart charging primitives that OCPP 1.6J lacks. ISO 15118-20 is the vehicle-side standard that turns V2G from a lab demo into a grid service; it handles bidirectional energy transfer, certificate-based authentication, and real-time power scheduling between charger and car. For the utility interface, OpenADR 2.0b is the de facto standard for DR events, while DNP3/IEC 61850 matter for sites that want to sell frequency regulation directly to a TSO.
The integration of a [V2G charging module](https://www.midapower.com/30kw-40kw-v2g-charging-module-bidirectional-ac-dc-converter-product/) into a site turns the vehicle fleet itself into a distributed battery. MIDA’s 30 kW/40 kW bidirectional modules and 15 kW/20 kW DC-DC V2G modules allow a depot to aggregate dozens of vehicles into a 1–2 MW virtual storage pool — capacity that participates in DR without any additional battery hardware.
Implementation Roadmap: From Invoice Pain to DR Revenue
A five-step sequence moves a site from passive billing to active grid participation:
1. Audit the load profile. Pull 12 months of 15-minute interval data from the utility meter. Identify the top-10 peak events, their duration, and their driver (fleet arrival, cold weather, events). 2. Right-size the battery. For a 120–480 kW charging site, a 200–500 kWh battery bank (roughly 0.5–1× charging power in kWh) covers 90% of peak-shaving needs. MIDA’s modular BESS stations — from the 120 kWh/60 kW to the [482 kWh/320 kW configurations](https://www.midapower.com/320kw-482kwh-bess-charger-mobile-ev-charging-station-energy-storage-system-product/) — allow capacity to be added in standard blocks. 3. Deploy the EMS and connect chargers via OCPP. Configure dynamic load management before touching DR programs; it alone can double site capacity utilization. 4. Join capacity and energy DR programs. Start with utility DR events (OpenADR), then move to TSO ancillary markets if local rules permit storage participation. 5. Add V2G and aggregation. Contract with an aggregator to bundle the site with other assets, unlocking frequency regulation and capacity market payments.
What This Means for Your Business Case
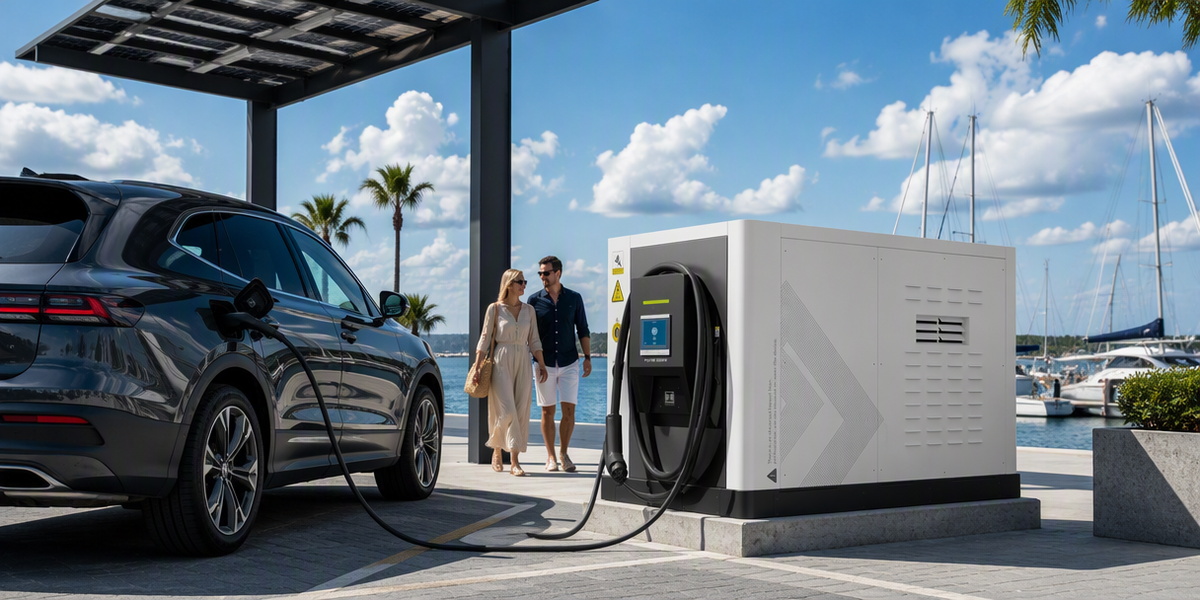
The economics of demand response are the difference between a charging site that barely breaks even and one that generates infrastructure-grade returns. Consider a 320 kW BESS charging station with 482 kWh of storage serving a highway hub. Demand charges drop by roughly 30%, saving 18,000–30,000 USD per year at typical commercial tariffs. TOU arbitrage adds another 8,000–15,000 USD annually. A capacity DR contract contributes 6,000–12,000 USD per year, and frequency regulation adds 10,000–25,000 USD if the TSO market is open. Combined annual benefits of 40,000–80,000 USD against a BESS premium of roughly 150,000–250,000 USD puts payback at 3–6 years — before accounting for the avoided cost of grid connection upgrades, which for many highway sites exceeds the battery cost entirely.
The sites that win the demand-response game are those that treat the battery as a grid asset rather than a charging accessory. Every kilowatt of storage should have a dispatch schedule, a revenue contract, and a measured outcome. With the modular architectures and OCPP/ISO 15118-native control available today, there is no technical barrier left between a charging site and the flexibility markets.
FAQ
1. What is demand response in a BESS charging station? Demand response is the practice of reducing or shifting a site’s grid consumption — or injecting stored energy — in response to price signals, utility DR events, or grid frequency regulation calls, using the station’s battery and smart control systems.
2. How much can demand response reduce my charging site’s electricity bill? Operators typically cut demand charges by 20–40% and energy costs by 10–30% through load shifting, with combined savings of 40,000–80,000 USD per year achievable on 300 kW-class sites.
3. Do drivers notice when the station participates in demand response? No. The EMS throttles or boosts charging within each session’s contracted power limits, and battery discharge covers the gap. Drivers see the same charging speeds and session times.
4. What is the difference between peak shaving and load shifting? Peak shaving caps the site’s maximum metered demand by discharging the battery during the peak interval, while load shifting moves energy consumption from expensive on-peak hours to cheap off-peak hours. Peak shaving targets the demand charge; load shifting targets the energy rate.
5. Does my BESS station need special protocols to join utility DR programs? Yes. OpenADR 2.0b for utility DR events, OCPP 2.0.1 for charger control, and ISO 15118 for V2G are the standards that matter. Older OCPP 1.6J equipment can still participate via the EMS but with fewer features.
6. Can vehicle batteries replace the on-site BESS for demand response? Partially. V2G-capable vehicles can contribute 50–150 kW of flexible capacity per small fleet, but the on-site BESS remains essential for guaranteed, always-available response — vehicles are parked unpredictably, batteries are not.
7. What is the payback period for a BESS at an EV charging site with DR optimization? With all four optimization layers active, payback typically falls in the 3–6 year range; sites that avoid grid connection upgrades can see payback inside 3 years.
Post time: Aug-14-2026
